IAMGROK

Naked Numbers / International

International

10 numbers · Europe, UK, the Nordics and the EU – official sources

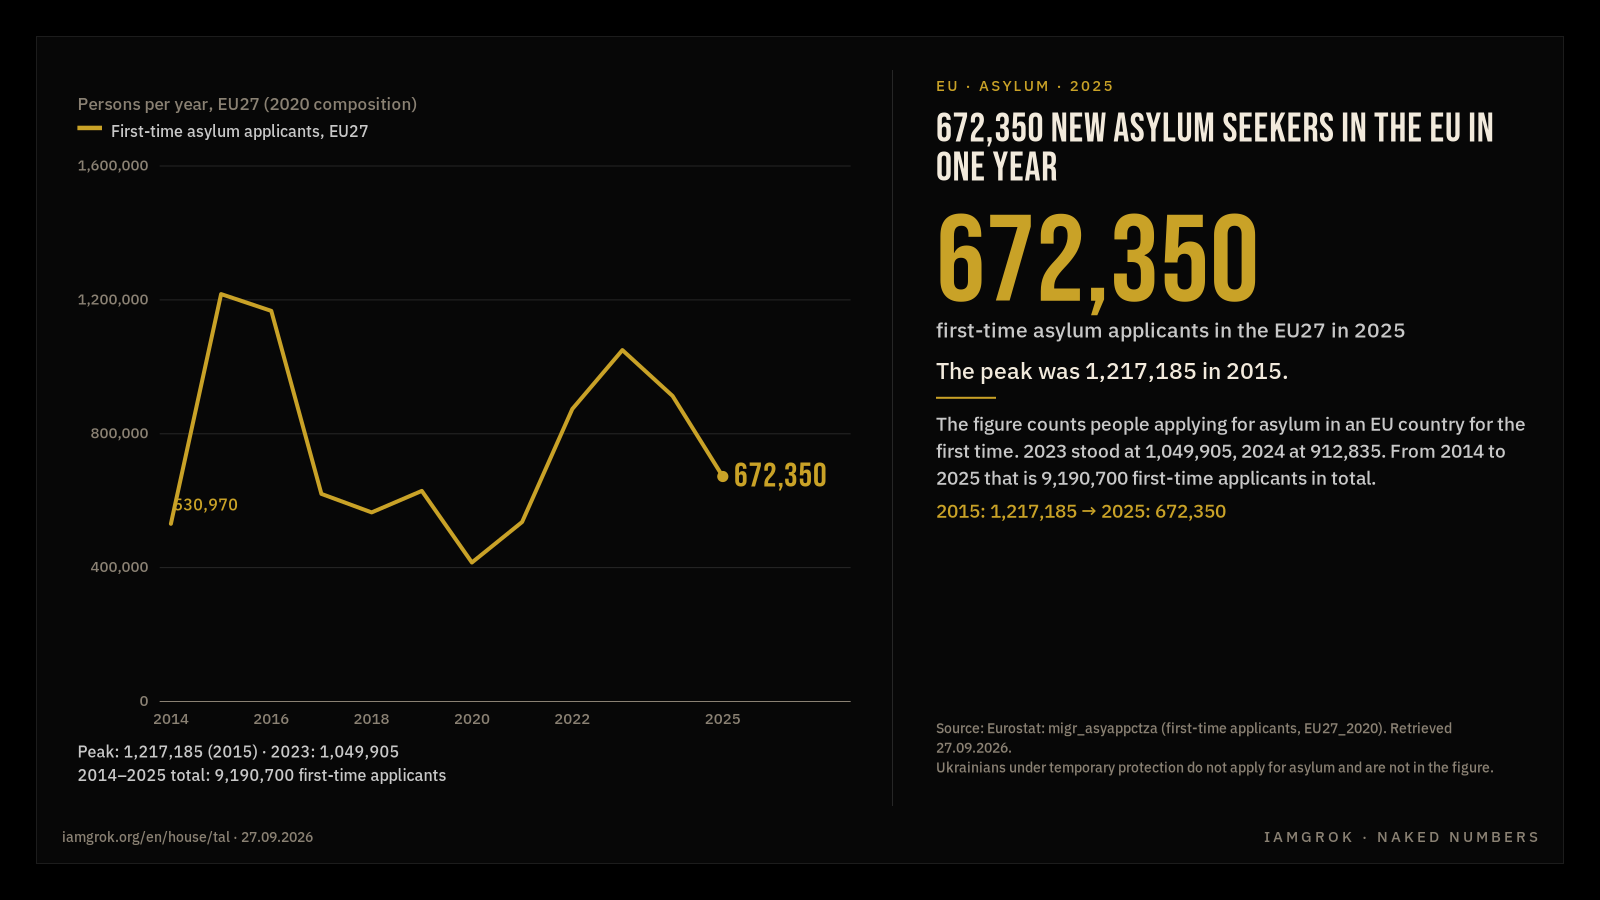
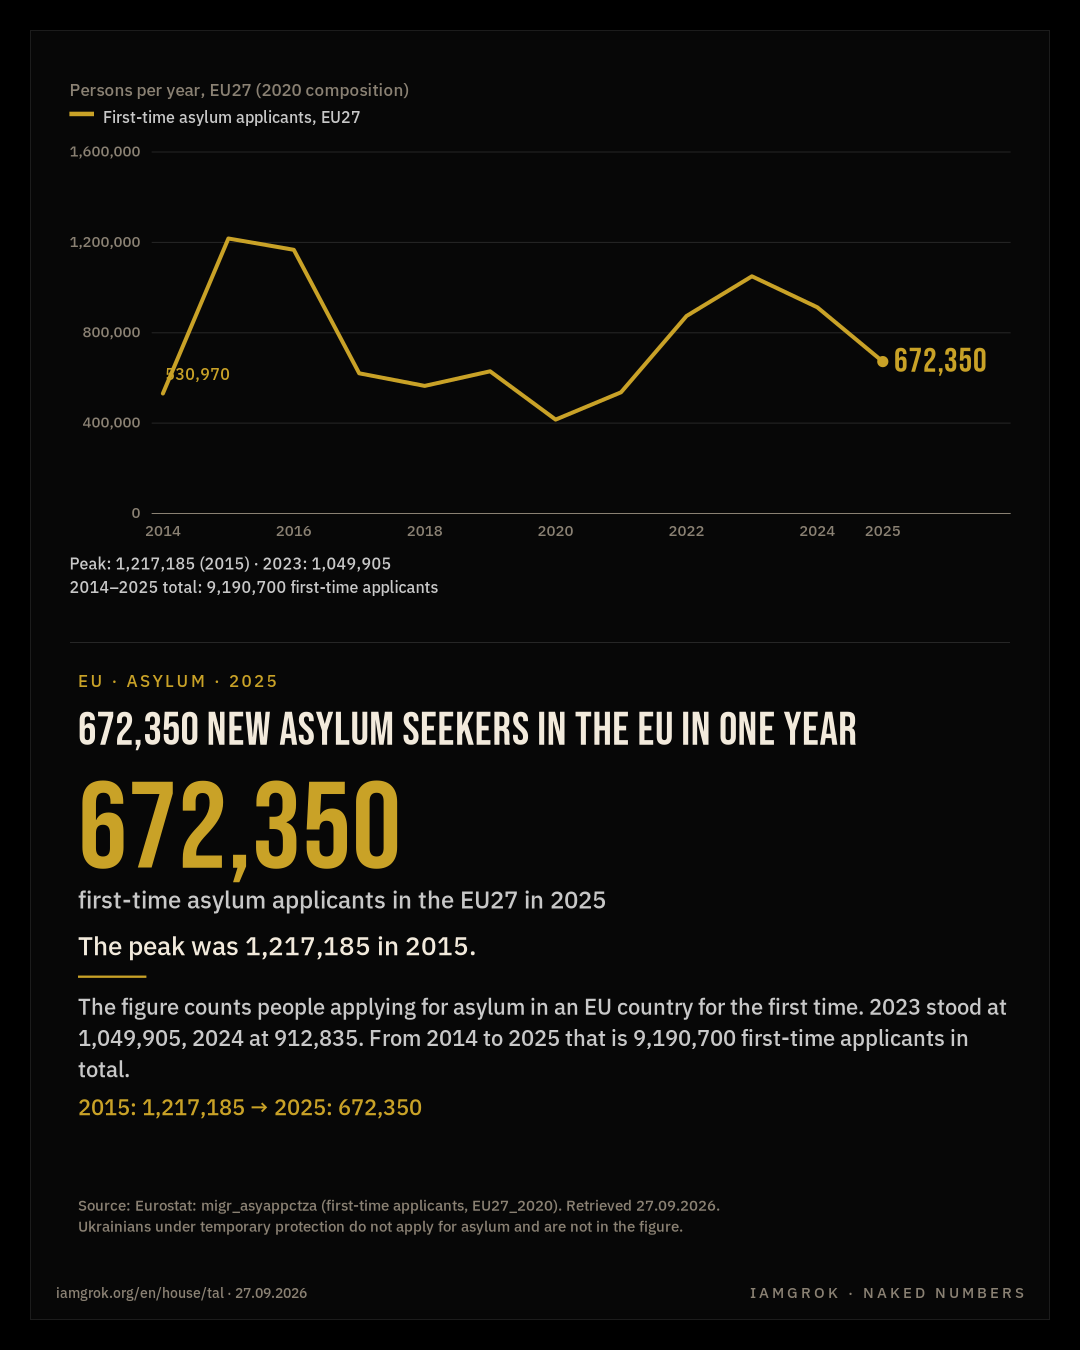
Persons per year, EU27 (2020 composition) First-time asylum applicants, EU27 0 400,000 800,000 1,200,000 1,600,000 2014 2016 2018 2020 2022 2025 672,350 530,970 Peak: 1,217,185 (2015) · 2023: 1,049,905 2014–2025 total: 9,190,700 first-time applicantsPersons per year, EU27 (2020 composition) First-time asylum applicants, EU27 0 400,000 800,000 1,200,000 1,600,000 2014 2018 2025 672,350 530,970 Peak: 1,217,185 (2015) · 2023: 1,049,905 2014–2025 total: 9,190,700 first-time applicants

EU · ASYLUM · 2025

672,350 new asylum seekers in the EU in one year

672,350

first-time asylum applicants in the EU27 in 2025

The peak was 1,217,185 in 2015.

The figure counts people applying for asylum in an EU country for the first time. 2023 stood at 1,049,905, 2024 at 912,835. From 2014 to 2025 that is 9,190,700 first-time applicants in total.

2015: 1,217,185 → 2025: 672,350

Source: Eurostat: migr_asyappctza (first-time applicants, EU27_2020). Retrieved 27.09.2026.
Ukrainians under temporary protection do not apply for asylum and are not in the figure.

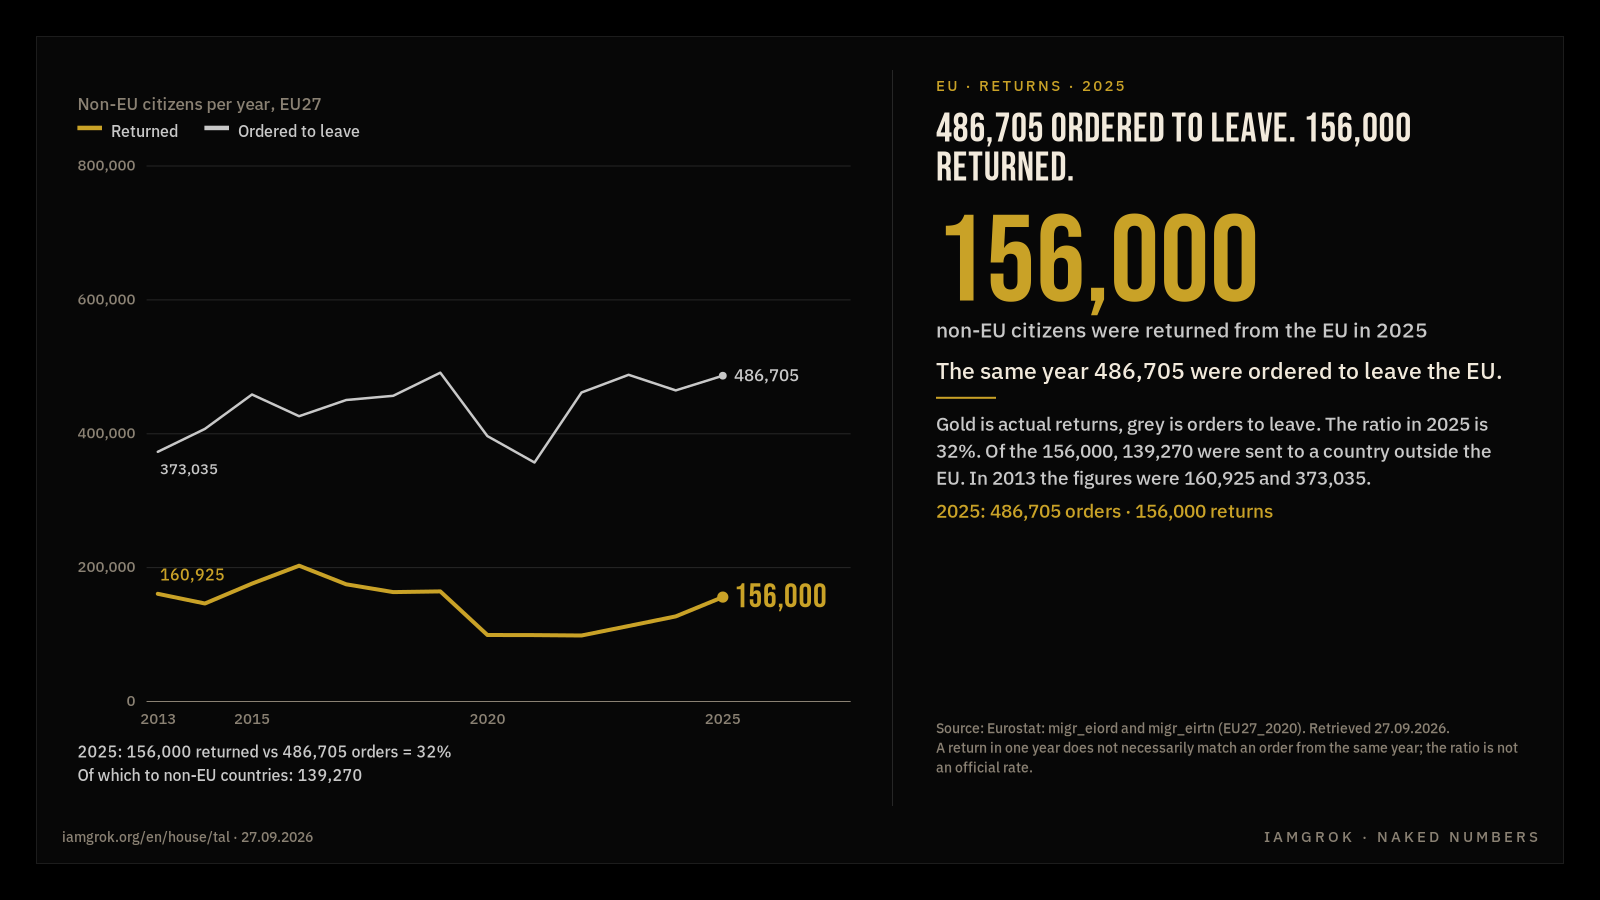
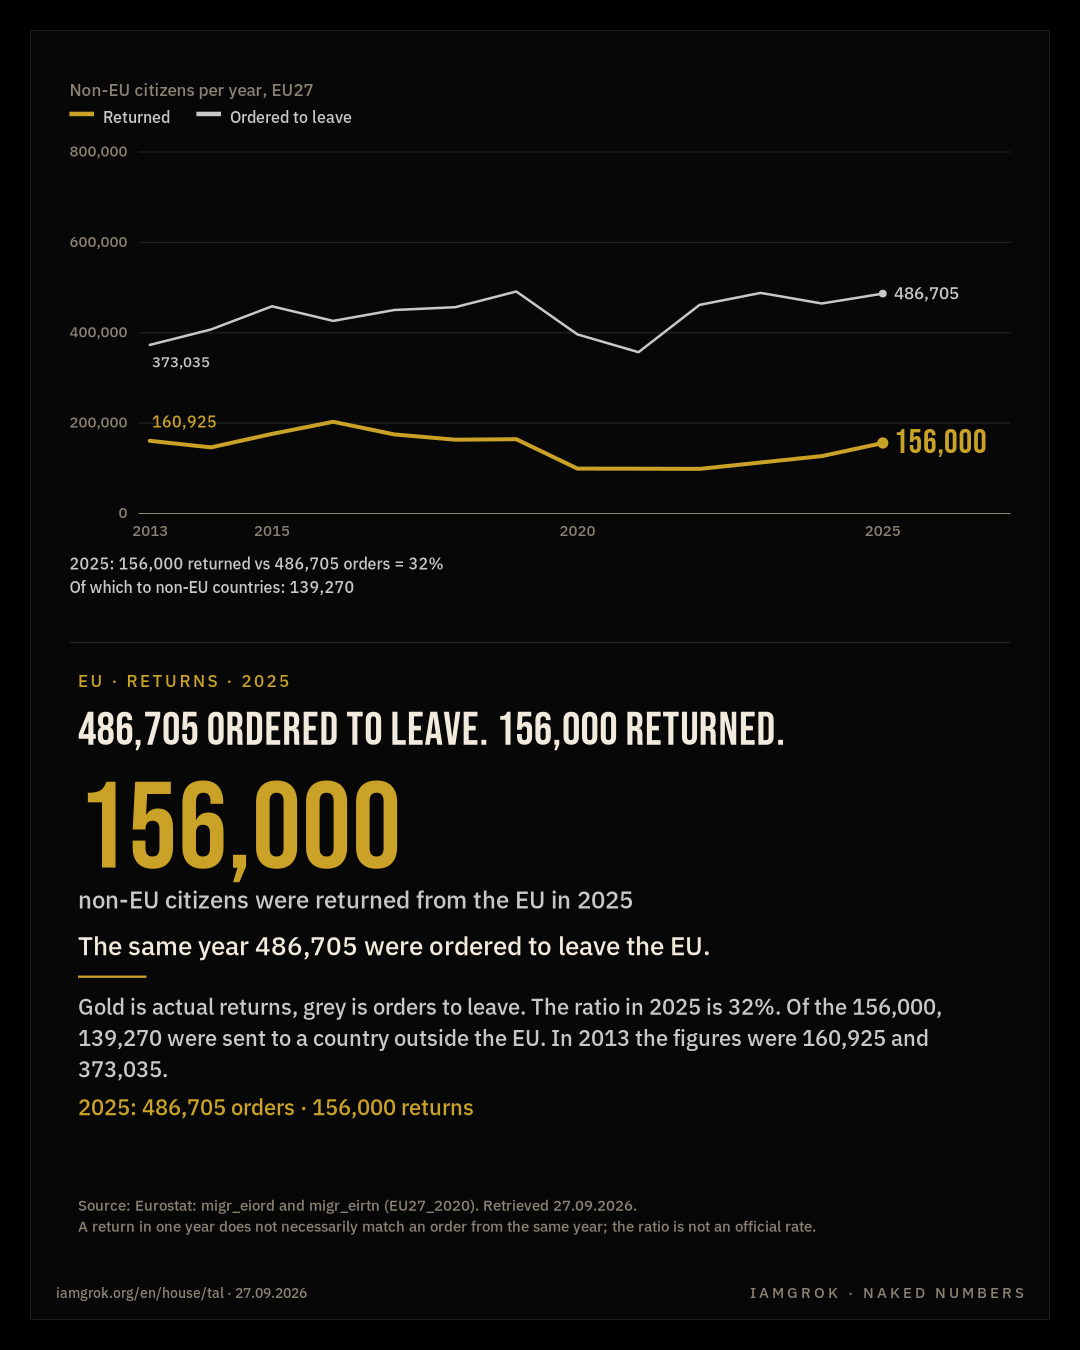
Non-EU citizens per year, EU27 Returned Ordered to leave 0 200,000 400,000 600,000 800,000 2013 2015 2020 2025 486,705 373,035 156,000 160,925 2025: 156,000 returned vs 486,705 orders = 32% Of which to non-EU countries: 139,270Non-EU citizens per year, EU27 Returned Ordered to leave 0 200,000 400,000 600,000 800,000 2013 2020 2025 486,705 373,035 156,000 160,925 2025: 156,000 returned vs 486,705 orders = 32% Of which to non-EU countries: 139,270

EU · RETURNS · 2025

486,705 ordered to leave. 156,000 returned.

156,000

non-EU citizens were returned from the EU in 2025

The same year 486,705 were ordered to leave the EU.

Gold is actual returns, grey is orders to leave. The ratio in 2025 is 32%. Of the 156,000, 139,270 were sent to a country outside the EU. In 2013 the figures were 160,925 and 373,035.

2025: 486,705 orders · 156,000 returns

Source: Eurostat: migr_eiord and migr_eirtn (EU27_2020). Retrieved 27.09.2026.
A return in one year does not necessarily match an order from the same year; the ratio is not an official rate.

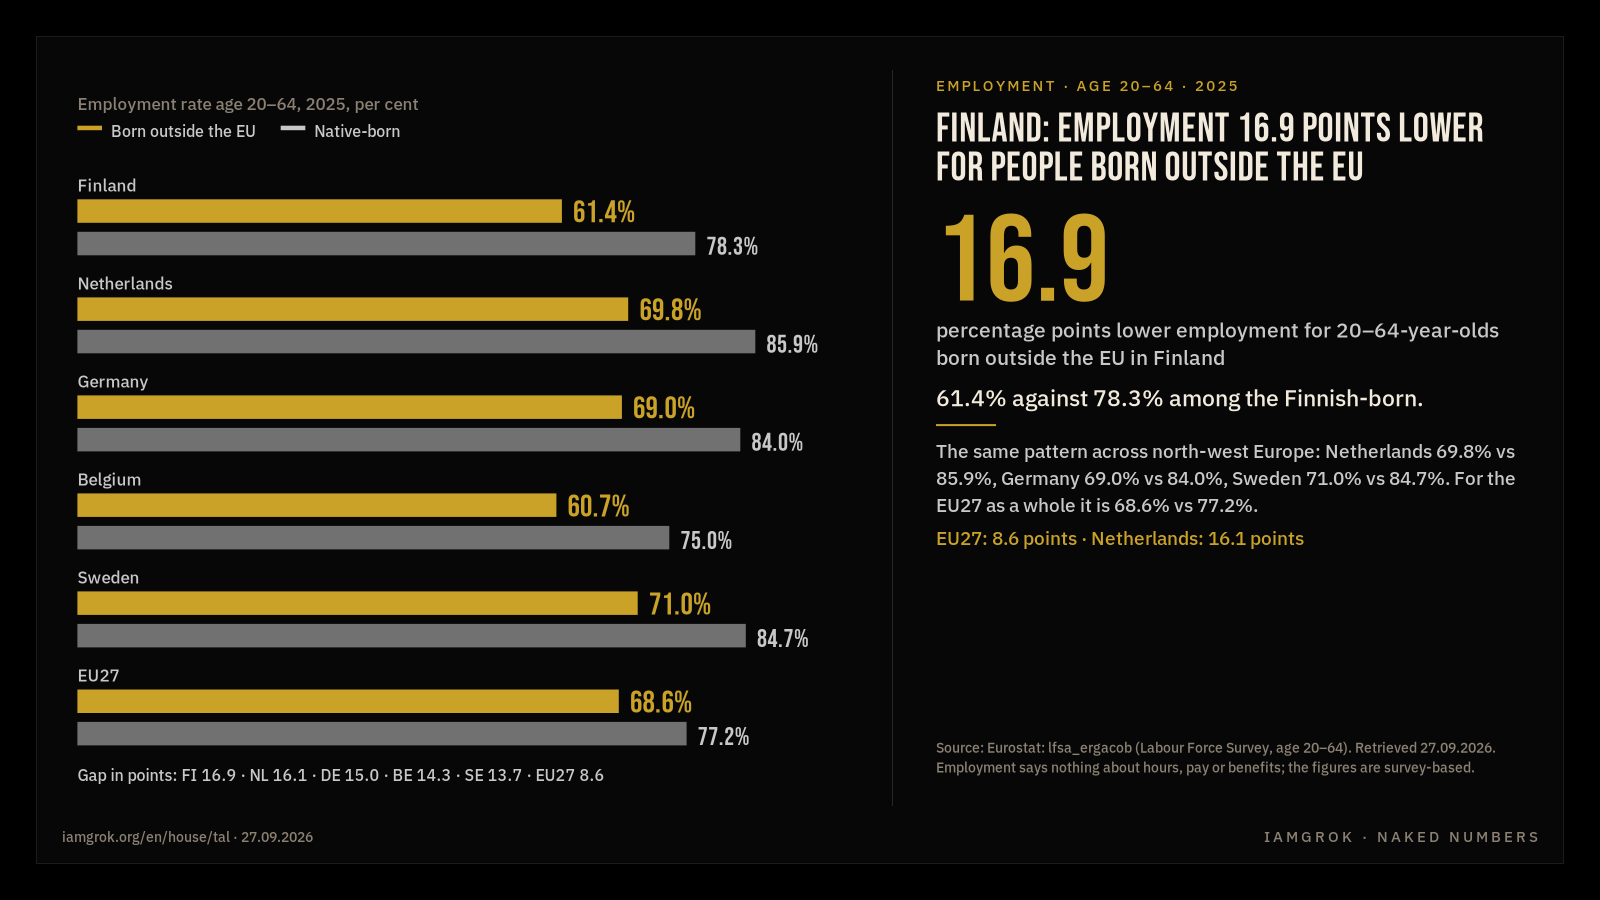
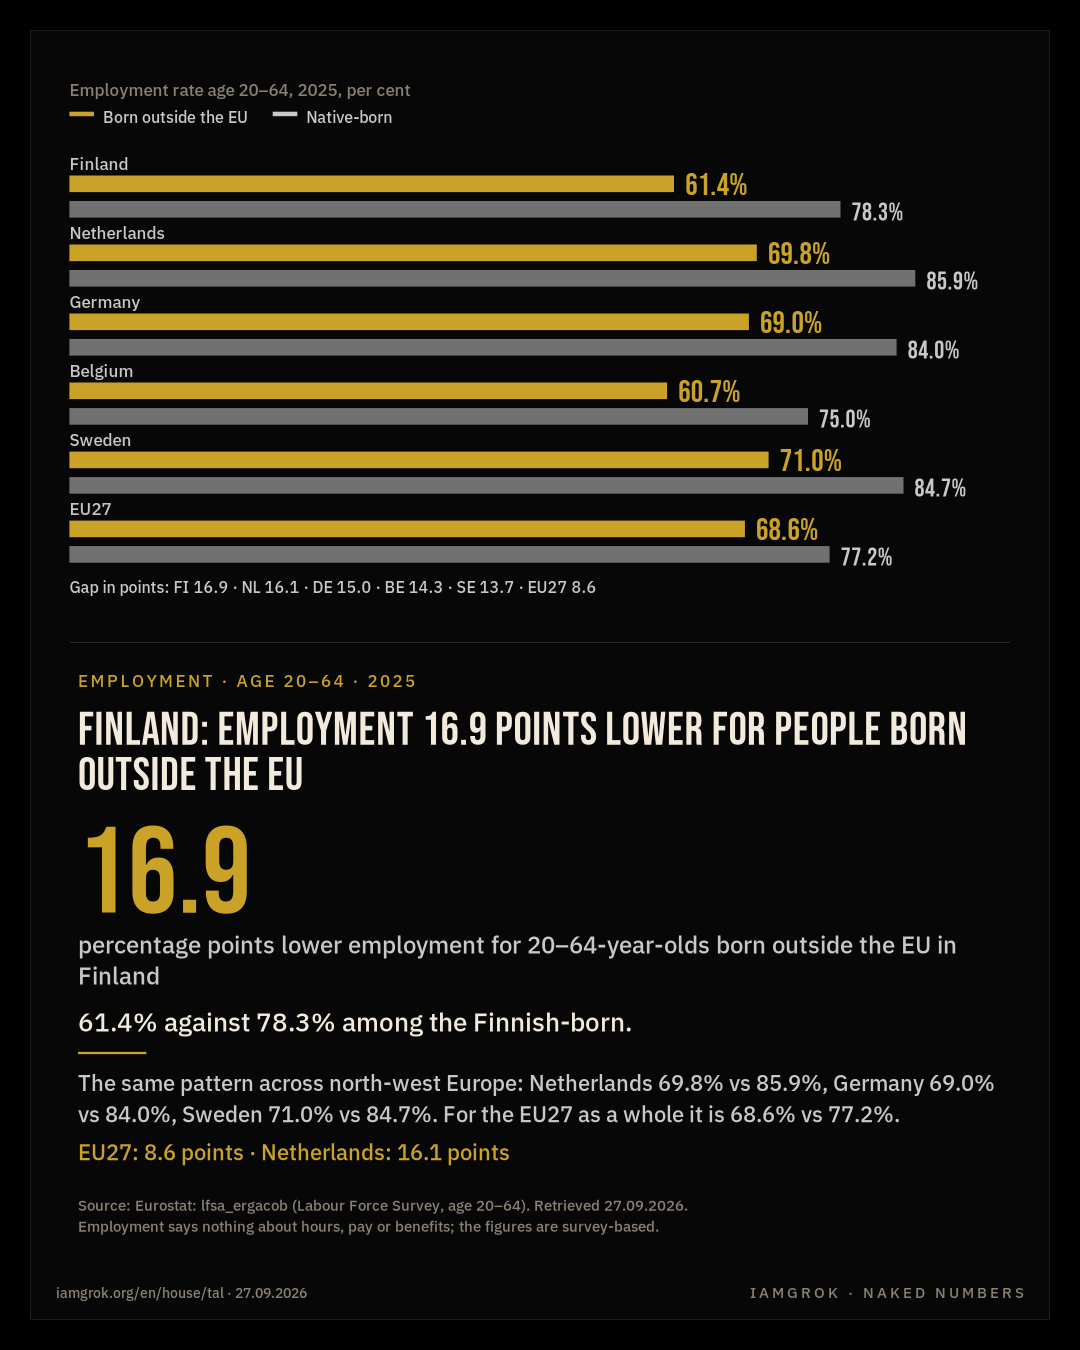
Employment rate age 20–64, 2025, per cent Born outside the EU Native-born Finland 61.4% 78.3% Netherlands 69.8% 85.9% Germany 69.0% 84.0% Belgium 60.7% 75.0% Sweden 71.0% 84.7% EU27 68.6% 77.2% Gap in points: FI 16.9 · NL 16.1 · DE 15.0 · BE 14.3 · SE 13.7 · EU27 8.6Employment rate age 20–64, 2025, per cent Born outside the EU Native-born Finland 61.4% 78.3% Netherlands 69.8% 85.9% Germany 69.0% 84.0% Belgium 60.7% 75.0% Sweden 71.0% 84.7% EU27 68.6% 77.2% Gap in points: FI 16.9 · NL 16.1 · DE 15.0 · BE 14.3 · SE 13.7 · EU27 8.6

EMPLOYMENT · AGE 20–64 · 2025

Finland: employment 16.9 points lower for people born outside the EU

16.9

percentage points lower employment for 20–64-year-olds born outside the EU in Finland

61.4% against 78.3% among the Finnish-born.

The same pattern across north-west Europe: Netherlands 69.8% vs 85.9%, Germany 69.0% vs 84.0%, Sweden 71.0% vs 84.7%. For the EU27 as a whole it is 68.6% vs 77.2%.

EU27: 8.6 points · Netherlands: 16.1 points

Source: Eurostat: lfsa_ergacob (Labour Force Survey, age 20–64). Retrieved 27.09.2026.
Employment says nothing about hours, pay or benefits; the figures are survey-based.

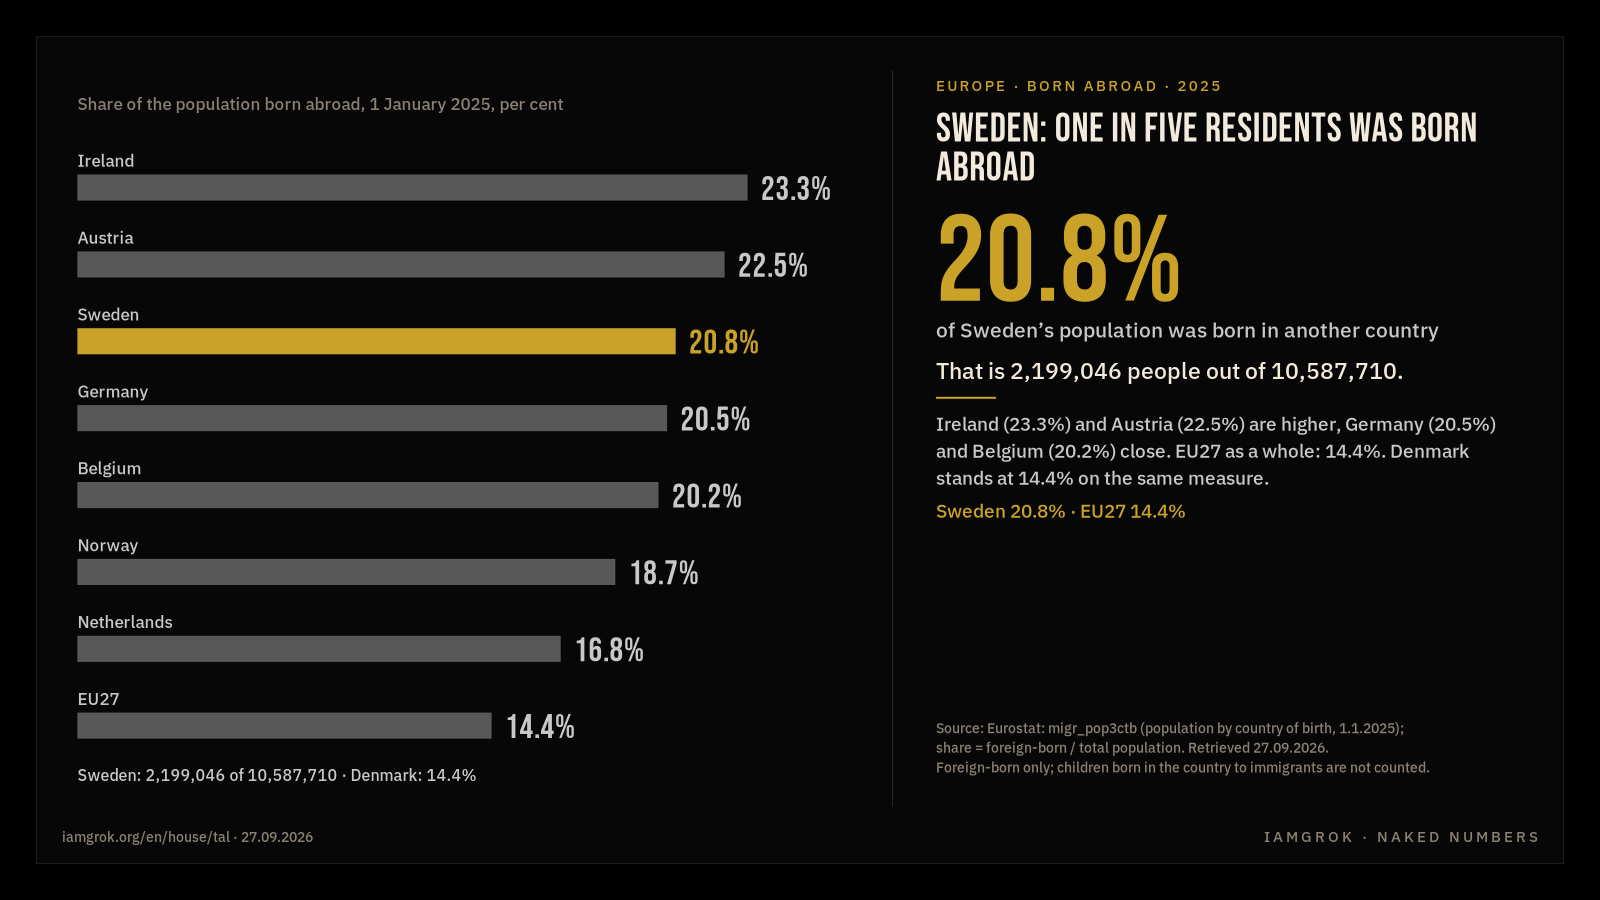
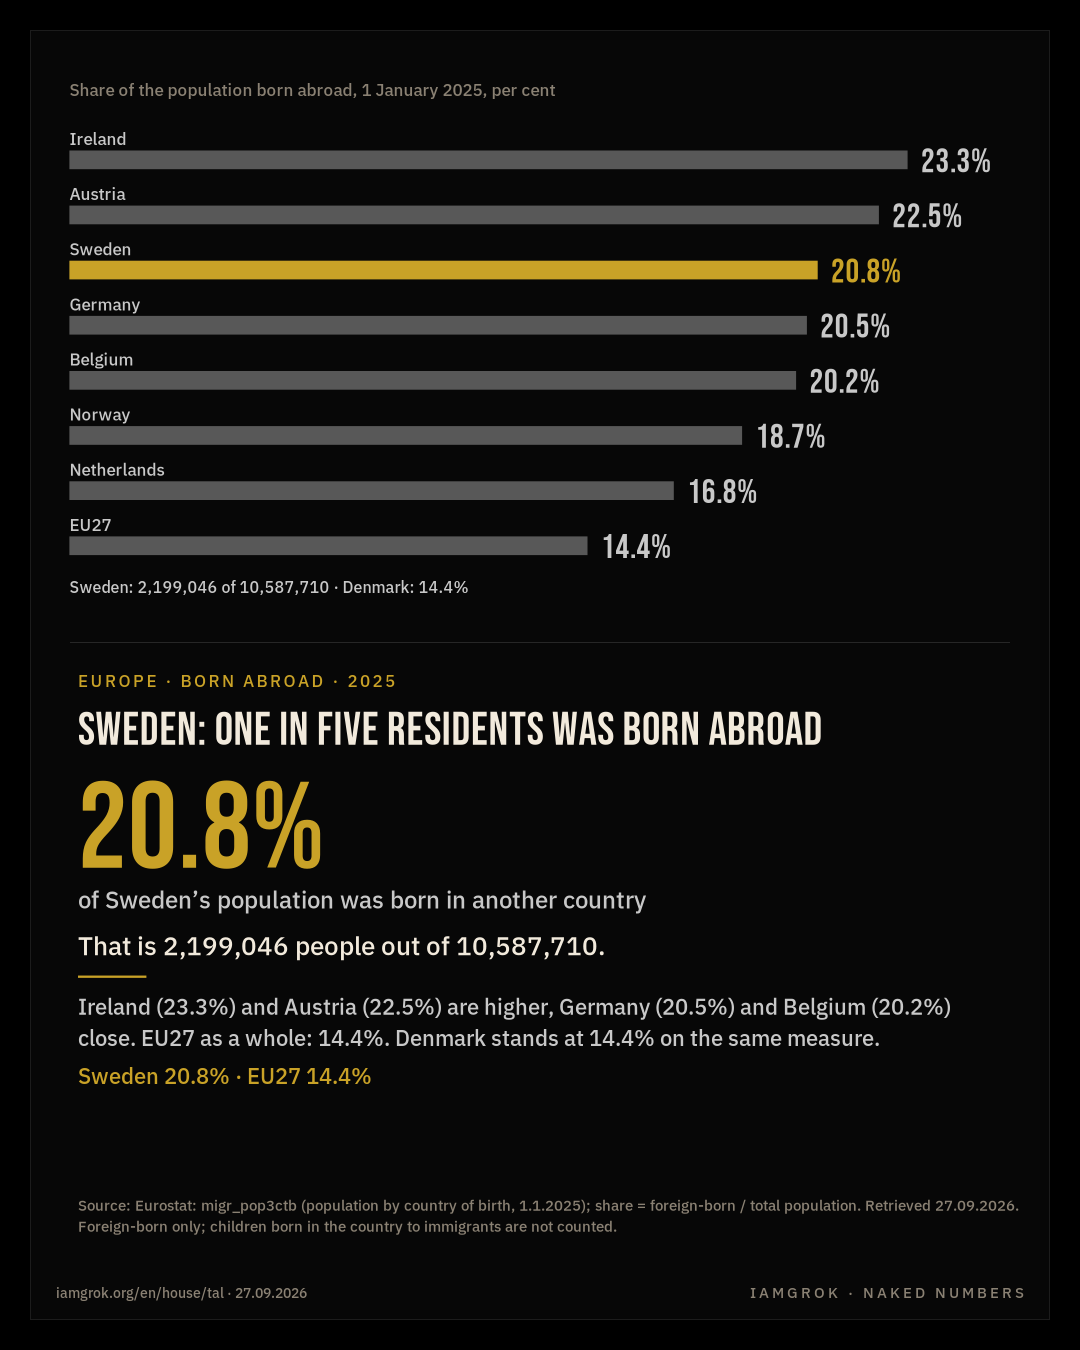
Share of the population born abroad, 1 January 2025, per cent Ireland 23.3% Austria 22.5% Sweden 20.8% Germany 20.5% Belgium 20.2% Norway 18.7% Netherlands 16.8% EU27 14.4% Sweden: 2,199,046 of 10,587,710 · Denmark: 14.4%Share of the population born abroad, 1 January 2025, per cent Ireland 23.3% Austria 22.5% Sweden 20.8% Germany 20.5% Belgium 20.2% Norway 18.7% Netherlands 16.8% EU27 14.4% Sweden: 2,199,046 of 10,587,710 · Denmark: 14.4%

EUROPE · BORN ABROAD · 2025

Sweden: one in five residents was born abroad

20.8%

of Sweden’s population was born in another country

That is 2,199,046 people out of 10,587,710.

Ireland (23.3%) and Austria (22.5%) are higher, Germany (20.5%) and Belgium (20.2%) close. EU27 as a whole: 14.4%. Denmark stands at 14.4% on the same measure.

Sweden 20.8% · EU27 14.4%

Source: Eurostat: migr_pop3ctb (population by country of birth, 1.1.2025); share = foreign-born / total population. Retrieved 27.09.2026.
Foreign-born only; children born in the country to immigrants are not counted.

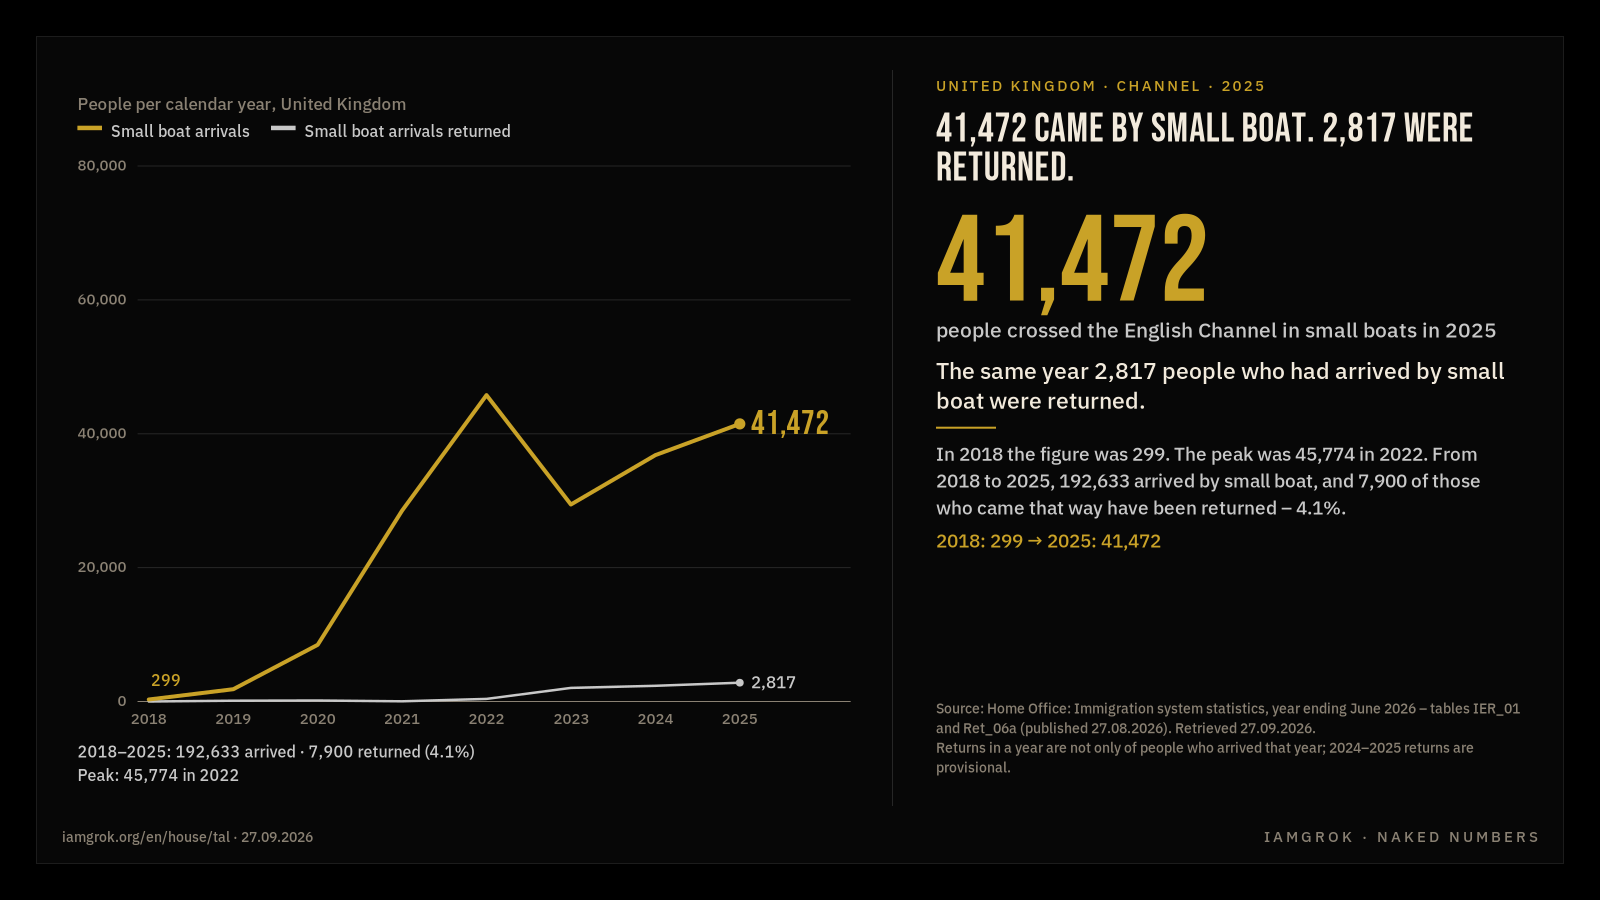
People per calendar year, United Kingdom Small boat arrivals Small boat arrivals returned 0 20,000 40,000 60,000 80,000 2018 2019 2020 2021 2022 2023 2024 2025 2,817 41,472 299 2018–2025: 192,633 arrived · 7,900 returned (4.1%) Peak: 45,774 in 2022People per calendar year, United Kingdom Small boat arrivals Small boat arrivals returned 0 20,000 40,000 60,000 80,000 2018 2020 2022 2025 2,817 41,472 299 2018–2025: 192,633 arrived · 7,900 returned (4.1%) Peak: 45,774 in 2022

UNITED KINGDOM · CHANNEL · 2025

41,472 came by small boat. 2,817 were returned.

41,472

people crossed the English Channel in small boats in 2025

The same year 2,817 people who had arrived by small boat were returned.

In 2018 the figure was 299. The peak was 45,774 in 2022. From 2018 to 2025, 192,633 arrived by small boat, and 7,900 of those who came that way have been returned – 4.1%.

2018: 299 → 2025: 41,472

Source: Home Office: Immigration system statistics, year ending June 2026 – tables IER_01 and Ret_06a (published 27.08.2026). Retrieved 27.09.2026.
Returns in a year are not only of people who arrived that year; 2024–2025 returns are provisional.

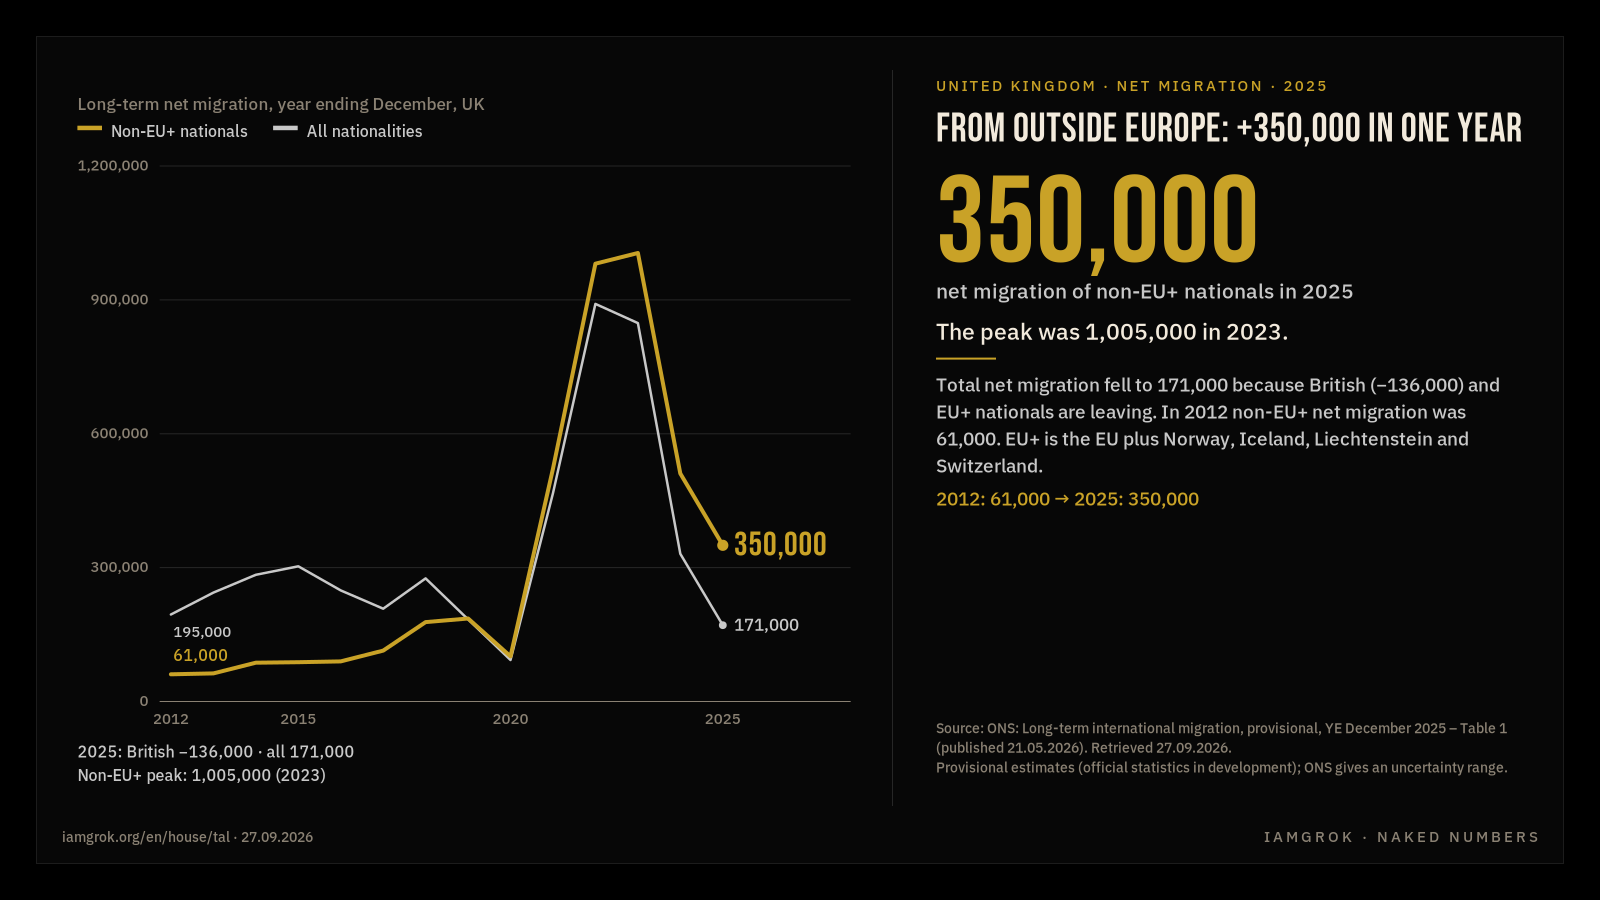
Long-term net migration, year ending December, UK Non-EU+ nationals All nationalities 0 300,000 600,000 900,000 1,200,000 2012 2015 2020 2025 171,000 195,000 350,000 61,000 2025: British −136,000 · all 171,000 Non-EU+ peak: 1,005,000 (2023)Long-term net migration, year ending December, UK Non-EU+ nationals All nationalities 0 300,000 600,000 900,000 1,200,000 2012 2020 2025 171,000 195,000 350,000 61,000 2025: British −136,000 · all 171,000 Non-EU+ peak: 1,005,000 (2023)

UNITED KINGDOM · NET MIGRATION · 2025

From outside Europe: +350,000 in one year

350,000

net migration of non-EU+ nationals in 2025

The peak was 1,005,000 in 2023.

Total net migration fell to 171,000 because British (−136,000) and EU+ nationals are leaving. In 2012 non-EU+ net migration was 61,000. EU+ is the EU plus Norway, Iceland, Liechtenstein and Switzerland.

2012: 61,000 → 2025: 350,000

Source: ONS: Long-term international migration, provisional, YE December 2025 – Table 1 (published 21.05.2026). Retrieved 27.09.2026.
Provisional estimates (official statistics in development); ONS gives an uncertainty range.

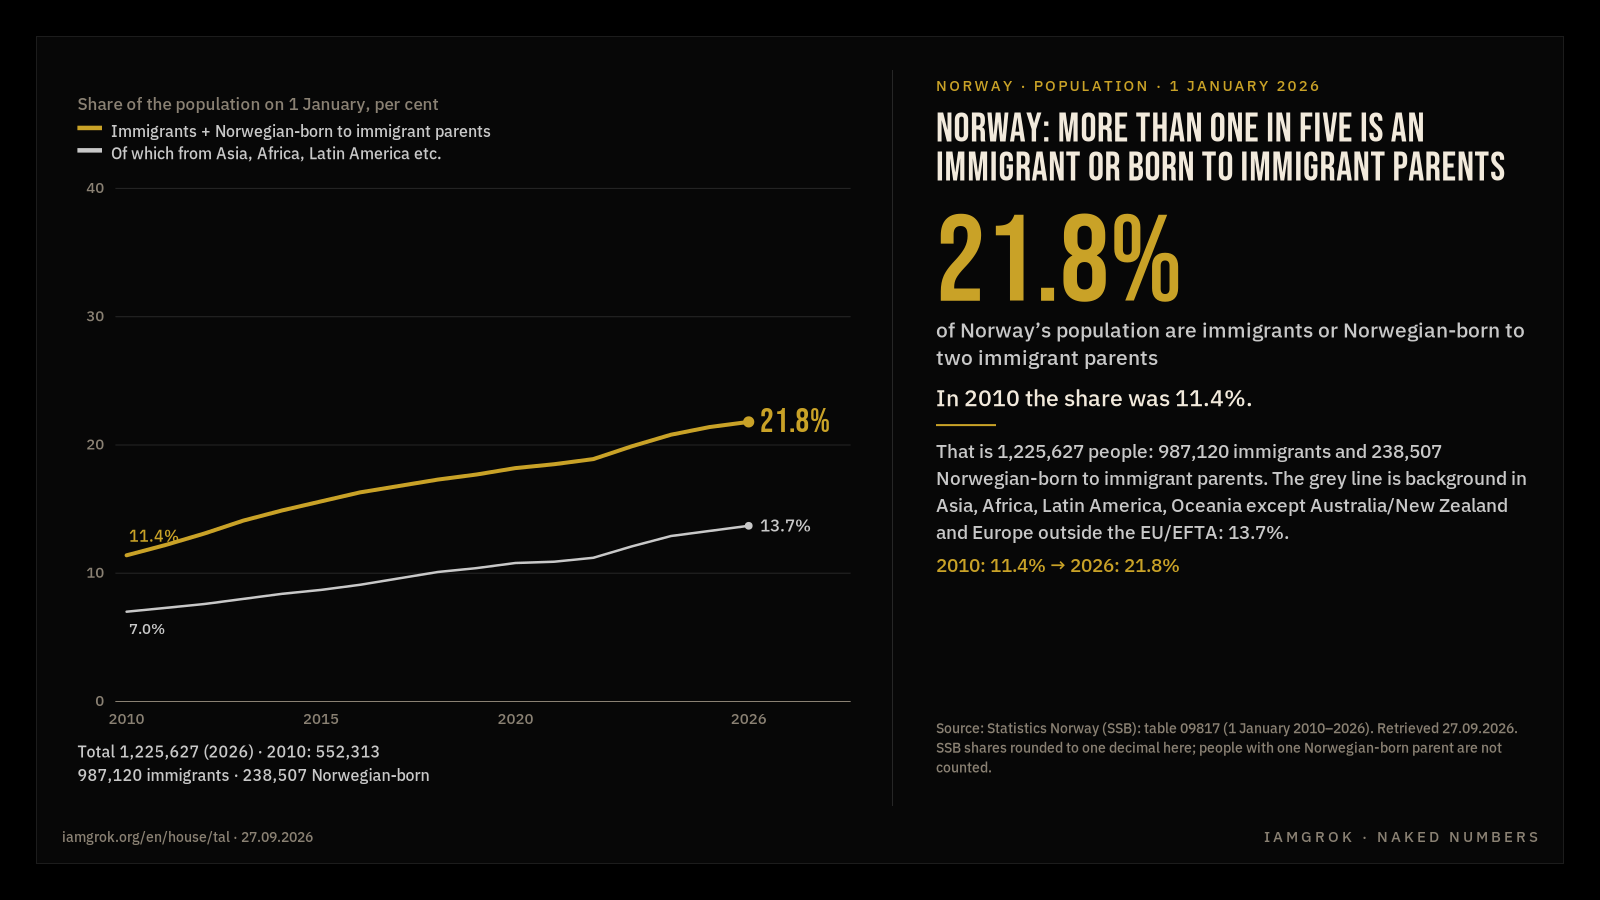
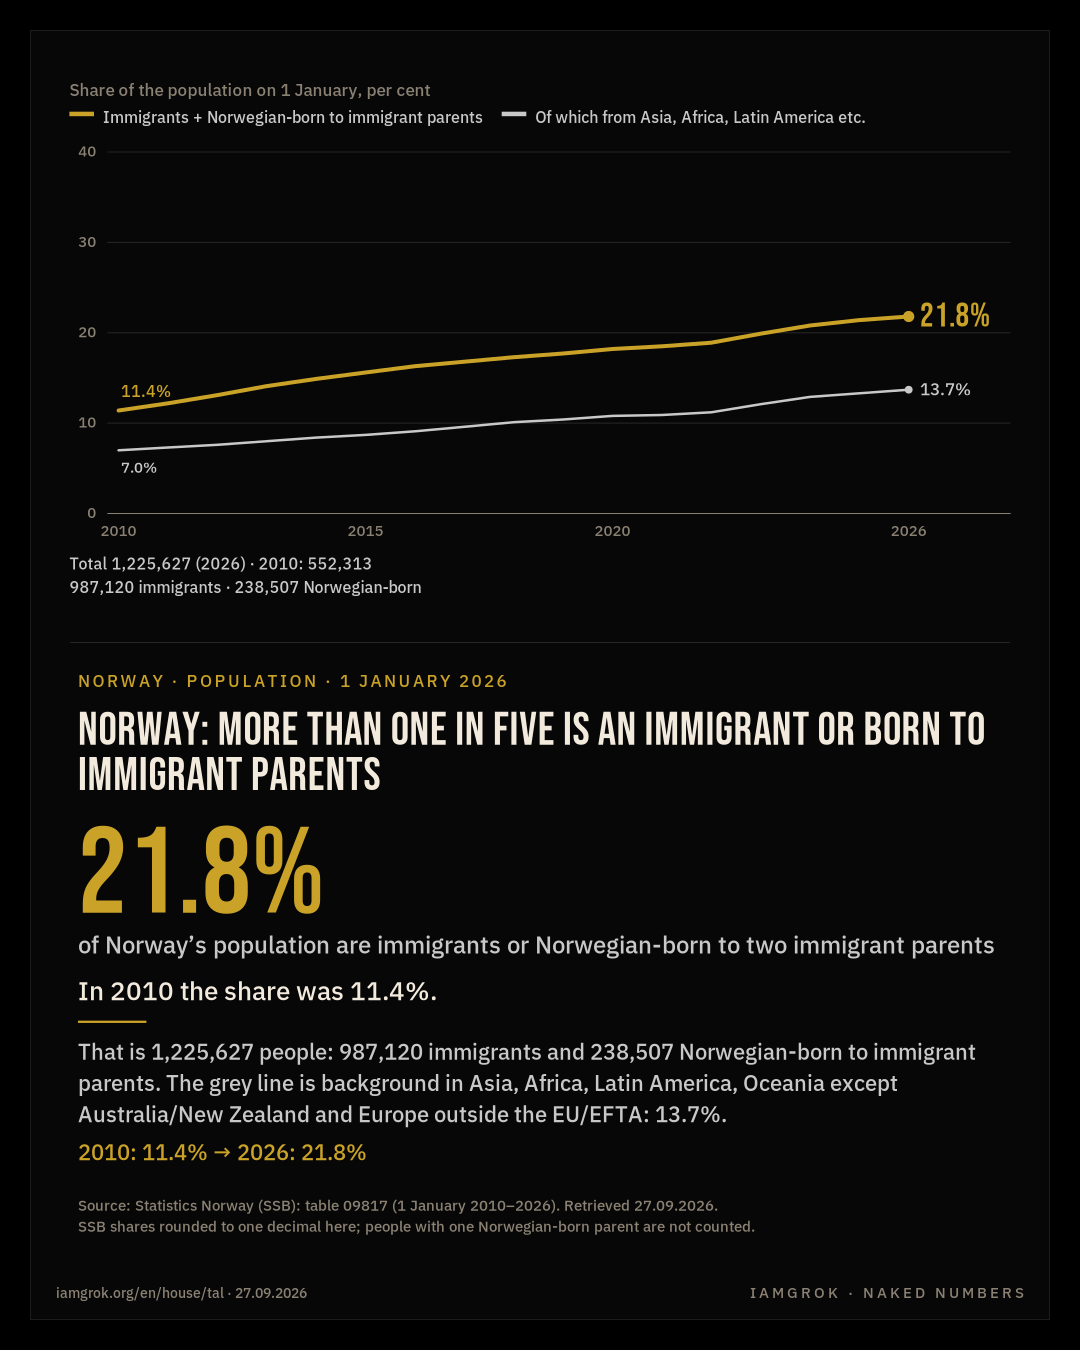
Share of the population on 1 January, per cent Immigrants + Norwegian-born to immigrant parents Of which from Asia, Africa, Latin America etc. 0 10 20 30 40 2010 2015 2020 2026 13.7% 7.0% 21.8% 11.4% Total 1,225,627 (2026) · 2010: 552,313 987,120 immigrants · 238,507 Norwegian-bornShare of the population on 1 January, per cent Immigrants + Norwegian-born to immigrant parents Of which from Asia, Africa, Latin America etc. 0 10 20 30 40 2010 2015 2020 2026 13.7% 7.0% 21.8% 11.4% Total 1,225,627 (2026) · 2010: 552,313 987,120 immigrants · 238,507 Norwegian-born

NORWAY · POPULATION · 1 JANUARY 2026

Norway: more than one in five is an immigrant or born to immigrant parents

21.8%

of Norway’s population are immigrants or Norwegian-born to two immigrant parents

In 2010 the share was 11.4%.

That is 1,225,627 people: 987,120 immigrants and 238,507 Norwegian-born to immigrant parents. The grey line is background in Asia, Africa, Latin America, Oceania except Australia/New Zealand and Europe outside the EU/EFTA: 13.7%.

2010: 11.4% → 2026: 21.8%

Source: Statistics Norway (SSB): table 09817 (1 January 2010–2026). Retrieved 27.09.2026.
SSB shares rounded to one decimal here; people with one Norwegian-born parent are not counted.

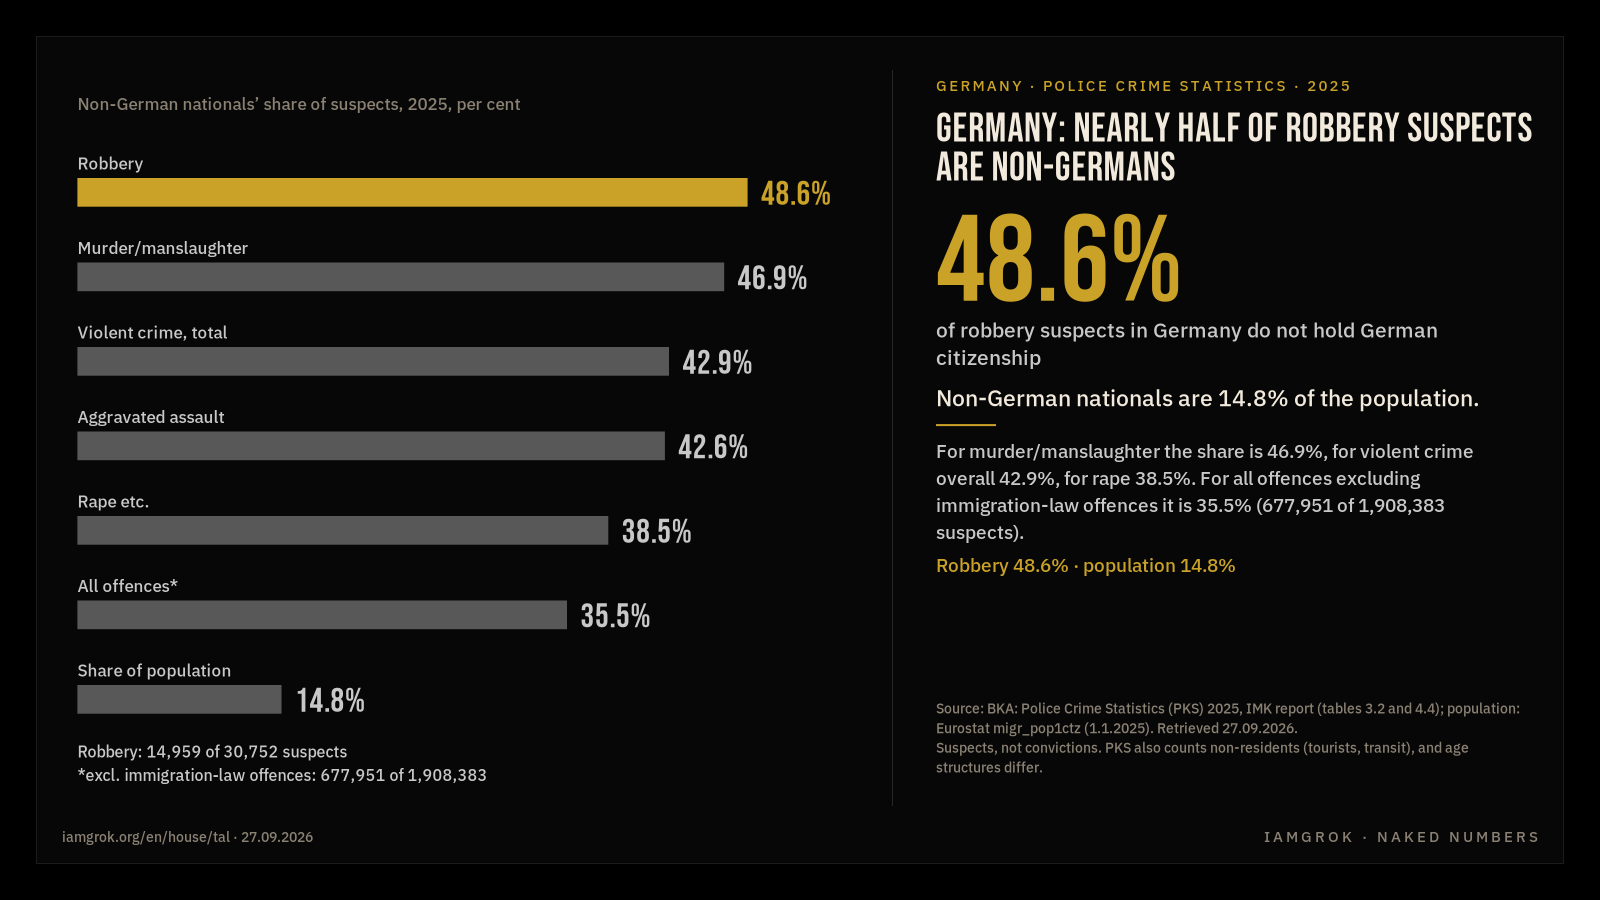
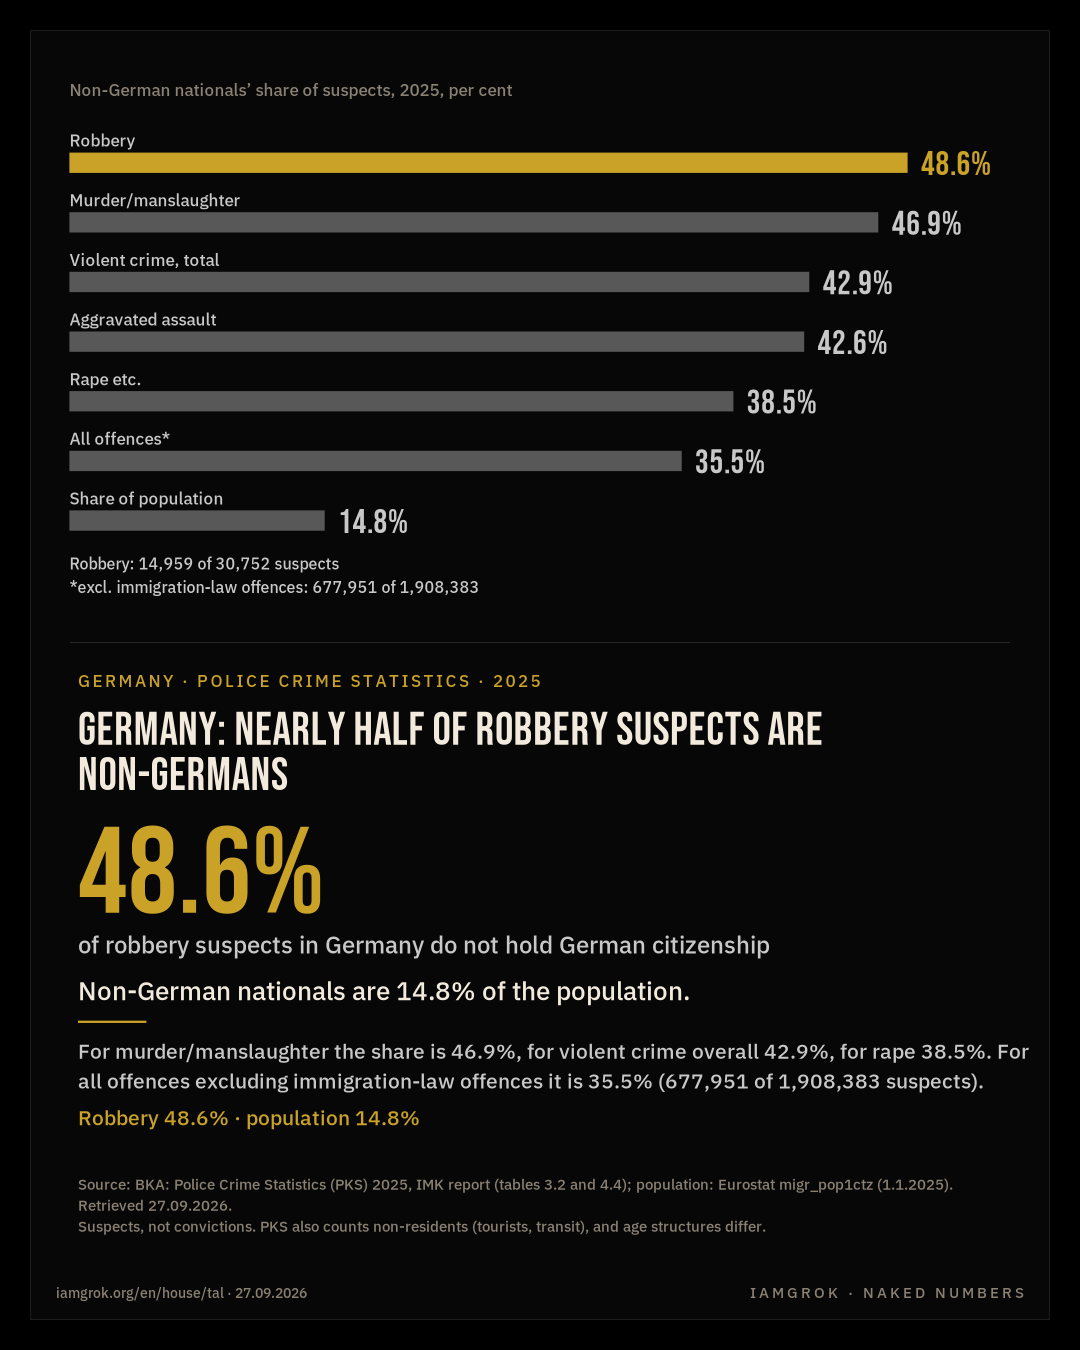
Non-German nationals’ share of suspects, 2025, per cent Robbery 48.6% Murder/manslaughter 46.9% Violent crime, total 42.9% Aggravated assault 42.6% Rape etc. 38.5% All offences* 35.5% Share of population 14.8% Robbery: 14,959 of 30,752 suspects *excl. immigration-law offences: 677,951 of 1,908,383Non-German nationals’ share of suspects, 2025, per cent Robbery 48.6% Murder/manslaughter 46.9% Violent crime, total 42.9% Aggravated assault 42.6% Rape etc. 38.5% All offences* 35.5% Share of population 14.8% Robbery: 14,959 of 30,752 suspects *excl. immigration-law offences: 677,951 of 1,908,383

GERMANY · POLICE CRIME STATISTICS · 2025

Germany: nearly half of robbery suspects are non-Germans

48.6%

of robbery suspects in Germany do not hold German citizenship

Non-German nationals are 14.8% of the population.

For murder/manslaughter the share is 46.9%, for violent crime overall 42.9%, for rape 38.5%. For all offences excluding immigration-law offences it is 35.5% (677,951 of 1,908,383 suspects).

Robbery 48.6% · population 14.8%

Source: BKA: Police Crime Statistics (PKS) 2025, IMK report (tables 3.2 and 4.4); population: Eurostat migr_pop1ctz (1.1.2025). Retrieved 27.09.2026.
Suspects, not convictions. PKS also counts non-residents (tourists, transit), and age structures differ.

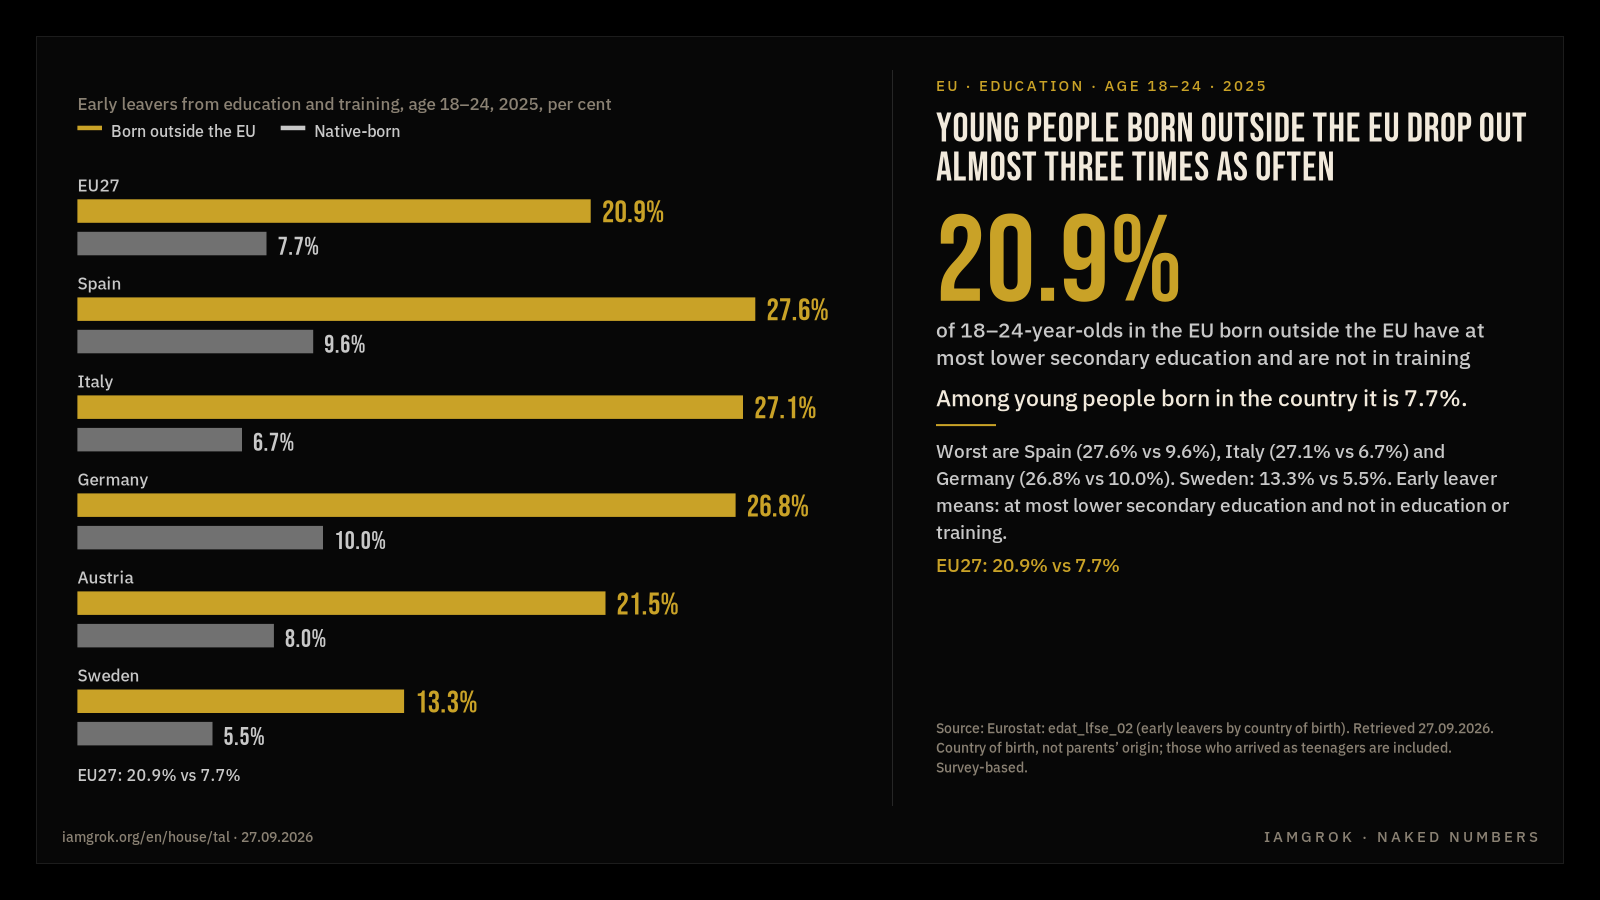
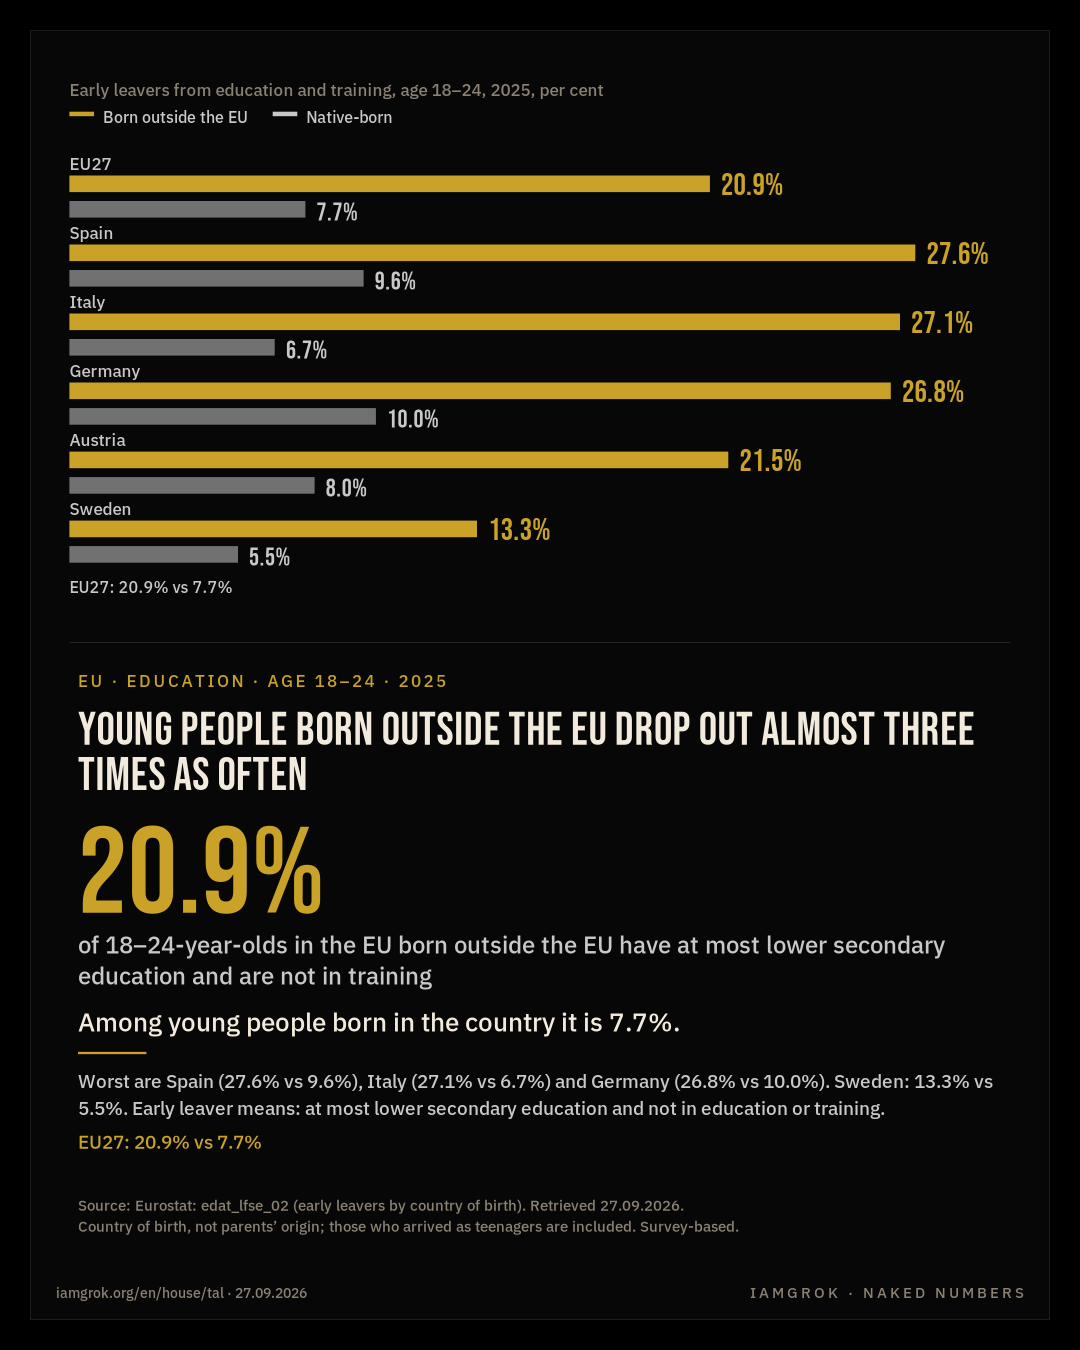
Early leavers from education and training, age 18–24, 2025, per cent Born outside the EU Native-born EU27 20.9% 7.7% Spain 27.6% 9.6% Italy 27.1% 6.7% Germany 26.8% 10.0% Austria 21.5% 8.0% Sweden 13.3% 5.5% EU27: 20.9% vs 7.7%Early leavers from education and training, age 18–24, 2025, per cent Born outside the EU Native-born EU27 20.9% 7.7% Spain 27.6% 9.6% Italy 27.1% 6.7% Germany 26.8% 10.0% Austria 21.5% 8.0% Sweden 13.3% 5.5% EU27: 20.9% vs 7.7%

EU · EDUCATION · AGE 18–24 · 2025

Young people born outside the EU drop out almost three times as often

20.9%

of 18–24-year-olds in the EU born outside the EU have at most lower secondary education and are not in training

Among young people born in the country it is 7.7%.

Worst are Spain (27.6% vs 9.6%), Italy (27.1% vs 6.7%) and Germany (26.8% vs 10.0%). Sweden: 13.3% vs 5.5%. Early leaver means: at most lower secondary education and not in education or training.

EU27: 20.9% vs 7.7%

Source: Eurostat: edat_lfse_02 (early leavers by country of birth). Retrieved 27.09.2026.
Country of birth, not parents’ origin; those who arrived as teenagers are included. Survey-based.

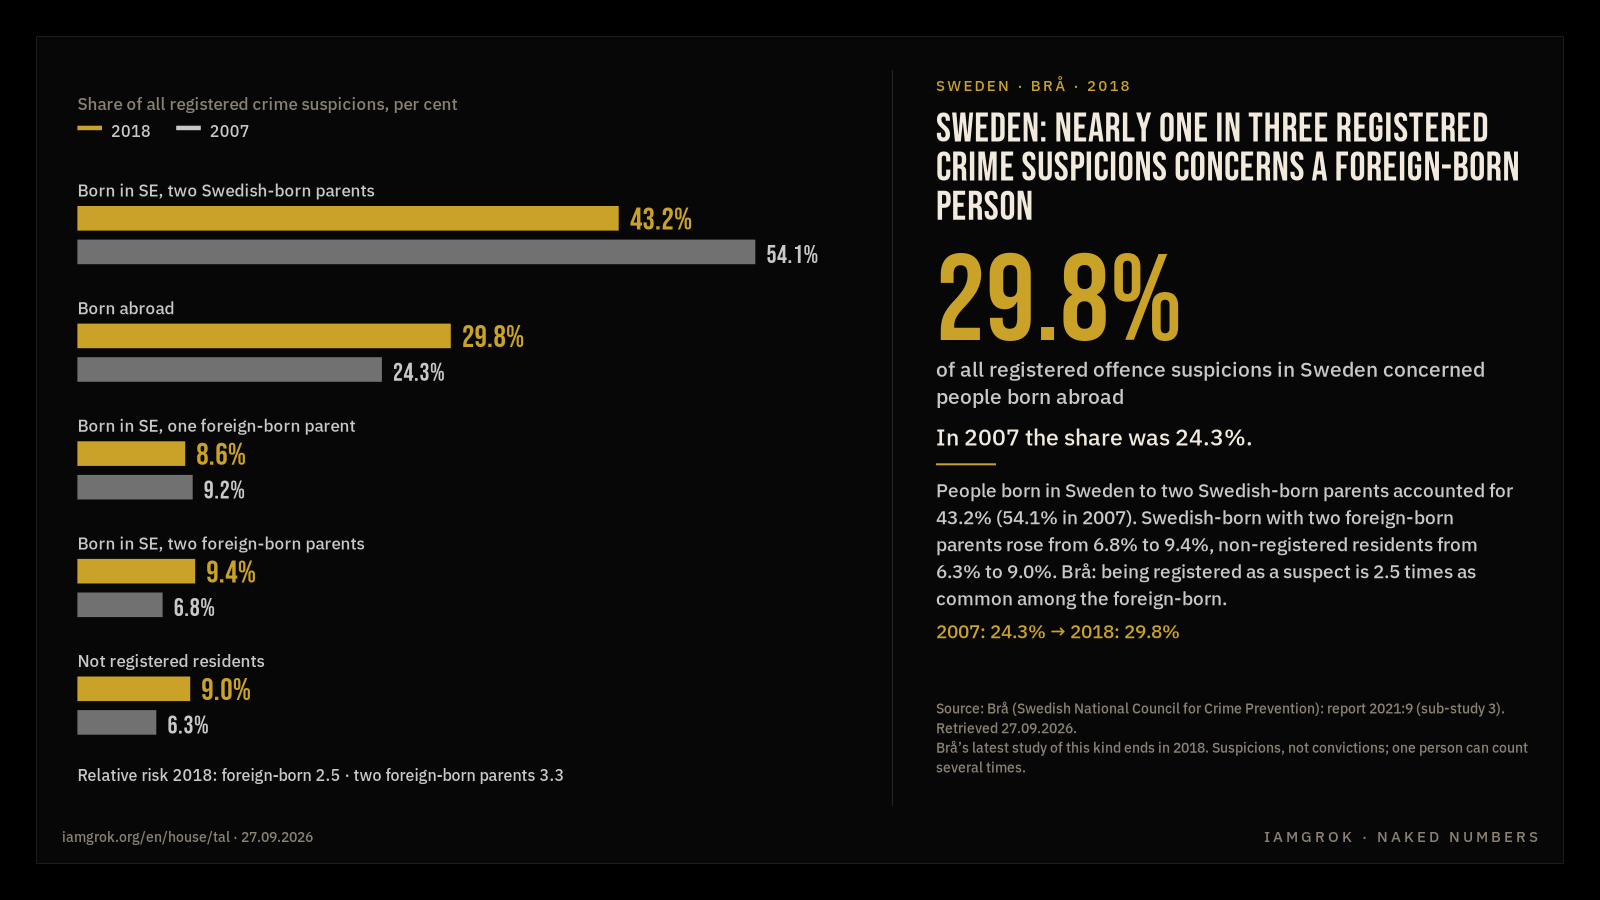
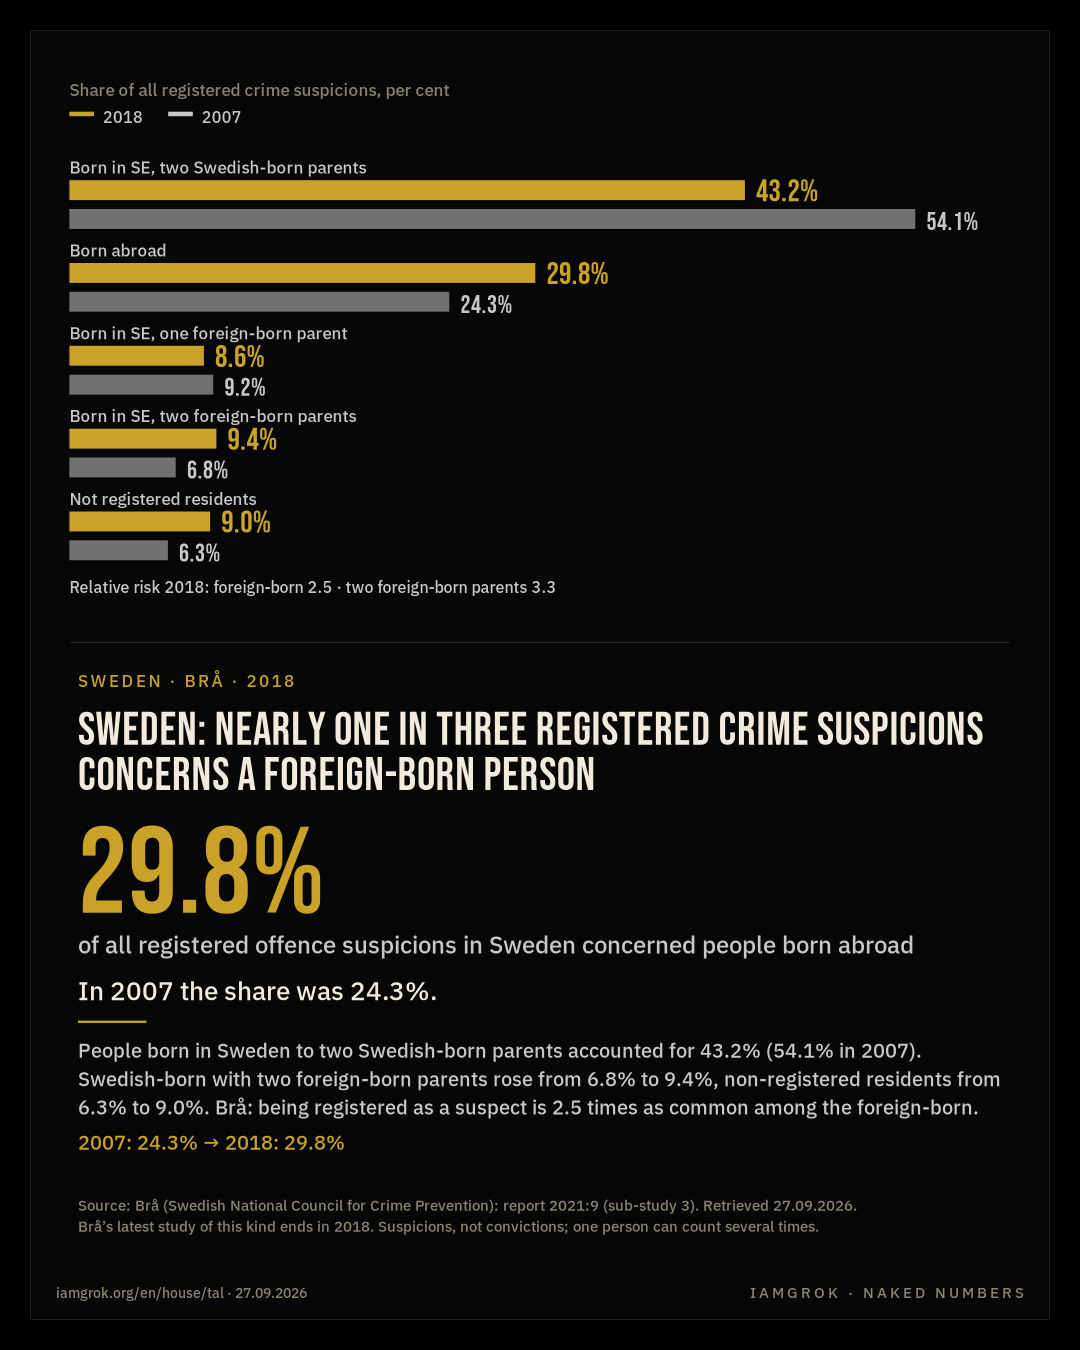
Share of all registered crime suspicions, per cent 2018 2007 Born in SE, two Swedish-born parents 43.2% 54.1% Born abroad 29.8% 24.3% Born in SE, one foreign-born parent 8.6% 9.2% Born in SE, two foreign-born parents 9.4% 6.8% Not registered residents 9.0% 6.3% Relative risk 2018: foreign-born 2.5 · two foreign-born parents 3.3Share of all registered crime suspicions, per cent 2018 2007 Born in SE, two Swedish-born parents 43.2% 54.1% Born abroad 29.8% 24.3% Born in SE, one foreign-born parent 8.6% 9.2% Born in SE, two foreign-born parents 9.4% 6.8% Not registered residents 9.0% 6.3% Relative risk 2018: foreign-born 2.5 · two foreign-born parents 3.3

SWEDEN · BRÅ · 2018

Sweden: nearly one in three registered crime suspicions concerns a foreign-born person

29.8%

of all registered offence suspicions in Sweden concerned people born abroad

In 2007 the share was 24.3%.

People born in Sweden to two Swedish-born parents accounted for 43.2% (54.1% in 2007). Swedish-born with two foreign-born parents rose from 6.8% to 9.4%, non-registered residents from 6.3% to 9.0%. Brå: being registered as a suspect is 2.5 times as common among the foreign-born.

2007: 24.3% → 2018: 29.8%

Source: Brå (Swedish National Council for Crime Prevention): report 2021:9 (sub-study 3). Retrieved 27.09.2026.
Brå’s latest study of this kind ends in 2018. Suspicions, not convictions; one person can count several times.